
Illustrative model — not a specific client. Every figure below is a projection built from real Hawaii benchmarks (Waikiki ADR $248 for October 2025, statewide occupancy 73.9% for full-year 2025, OTA commissions 15–25%, independent direct-booking share ~37%). The numbers show how the Reef Method would play out for a representative property — they are not a verified engagement outcome.
Modeled scenario // 37-room independent Waikiki hotel · 73.9% occupancy · $248 ADR
Recovering ~$75K/yr From OTA Commissions.
An illustrative model — not a client. How a 37-room independent Waikiki hotel could move direct-booking share from 41% to 58%, and what that shift is worth, using the Reef Method and real 2026 Hawaii hospitality benchmarks.
$75K
Modeled OTA recovery / yr
58%
Target direct share (from 41%)
2.1×
Modeled year-one ROI
Why direct-booking share is the whole game
Independent Hawaii hotels lose more margin to online travel agencies (OTAs) than to any other line item they don't control. Industry data puts roughly 61% of independent-hotel bookings through OTAs, and the blended commission on a Booking.com or Expedia reservation runs 15–25% of room revenue — before you count the rate-parity constraints and the guest data the OTA keeps for itself.
The lever that moves the most margin is therefore the simplest to state and the hardest to execute: shift a larger share of the same demand to the direct channel. This page models exactly what that shift is worth for a representative property — using only real Hawaii benchmarks — so the math is auditable rather than aspirational.
The modeled property
A 37-room independent boutique hotel in Waikiki. We hold every input to a published Hawaii benchmark:
- ADR $248 — Waikiki average daily rate (DBEDT, October 2025, single month).
- 73.9% occupancy — Hawaii statewide average (HTA, full-year 2025).
- Blended OTA commission ~18% — midpoint of the 15–25% range hotels actually pay.
- 41% direct-booking share today — just above the ~37% independent average (Phocuswright). Branded chains average ~65%, so 41% leaves substantial room.
Annual room revenue models to ≈ $2.48M (37 rooms × $248 × 73.9% × 365). The only variable we move is direct-booking share; rate and occupancy stay fixed, so every dollar below comes from changing which channel the booking flows through — not from charging more or filling more rooms.
The math, in full
At today's 41% direct share
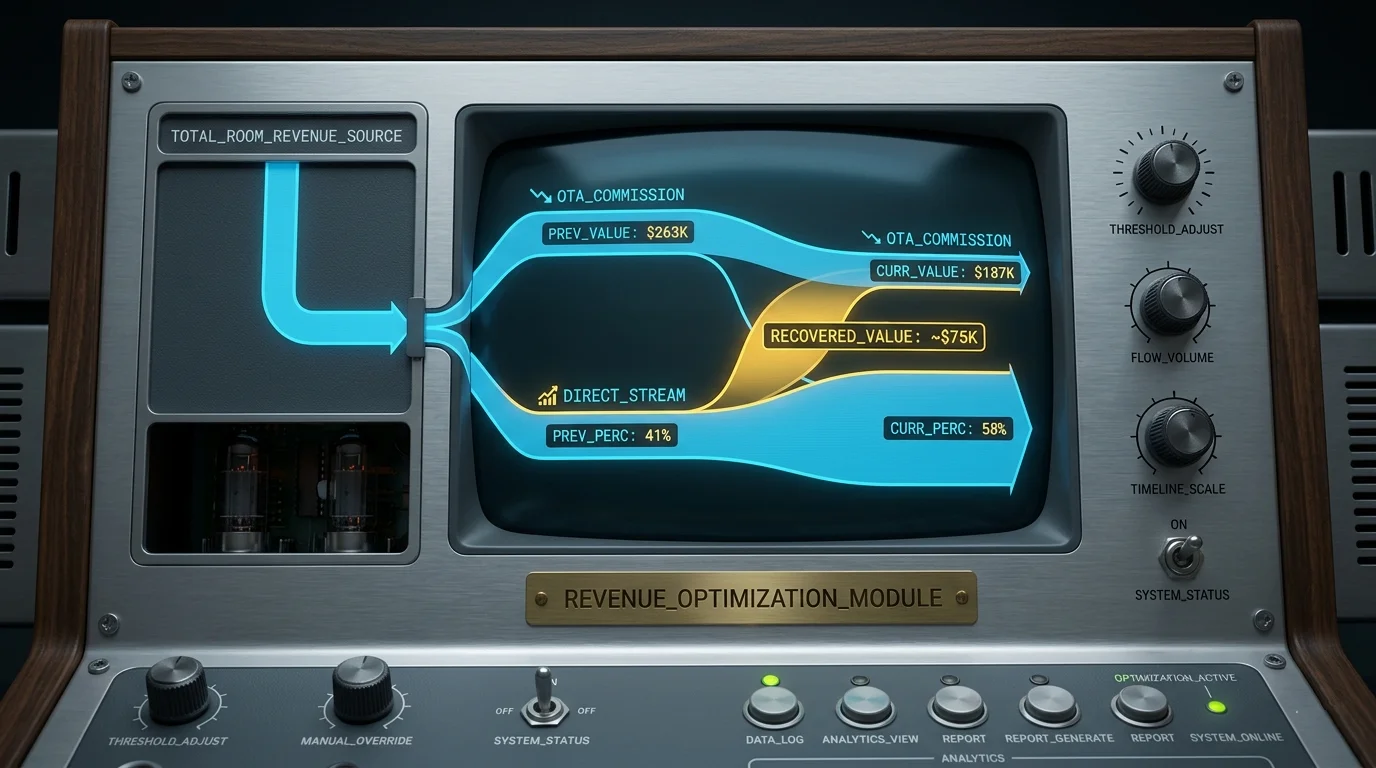
- OTA-channeled revenue: 59% × $2.48M = ≈ $1.46M
- OTA commissions paid: 18% × $1.46M = ≈ $263K / year
At a modeled 58% direct share (still below the 65% branded benchmark)
- OTA-channeled revenue: 42% × $2.48M = ≈ $1.04M
- OTA commissions paid: 18% × $1.04M = ≈ $187K / year
Modeled annual recovery ≈ $75K/year in commissions that stop leaving the property. Against a representative ~$3K/month ($36K/year) engagement, that is a modeled ~2.1× year-one return — before counting the guest email, repeat-booking value, and rate-parity freedom the direct channel returns.
The cost of inaction is the mirror image: at status quo, the property keeps writing a ~$263K/year check to the OTAs for demand it could increasingly capture itself.
How the Reef Method gets there
Direct-booking share doesn't move because of one tactic; it moves because four layers reinforce each other over a 12-month horizon. Here is how each layer applies to this property.
01 · Substrate — make the booking path legible and fast
Hotel and room-type schema with live rate markup, a clean handoff into the booking engine (the single biggest direct-conversion leak for boutique properties), and Core Web Vitals fixed on the booking flow. If the direct path is slower or more confusing than the OTA's, guests default to the OTA — so this layer is the precondition for everything above it.
02 · Coral — own the searches that precede a booking
Waikiki neighborhood and "things to do" guides, room-type and direct-perk pages, and editorial content answering the planning questions a guest asks before they're ready to book. This is the topical authority that makes the property a destination in search rather than a line item on an OTA results page.
03 · Citations — close the boutique-hotel AI-visibility gap
Our Hawaii AI Citation Analysis documented a structural pattern: boutique hotels are systematically under-cited by AI engines relative to the big-brand resorts, even when they're the better answer for a query like "best small hotels in Waikiki." Closing that gap — through entity binding, review signals, and question-shaped content AI engines cite — is the primary layer for this property, because AI-assisted trip planning increasingly originates the direct demand this model depends on.
04 · Ecosystem — compound the direct relationship
Reviews, brand mentions, and a repeat-guest loop (the email captured on a direct booking is an asset the OTA channel never hands back). Over time this is what holds direct share at the new level instead of letting it erode back toward the OTA default.
What this model is — and isn't
This is an illustrative model, not a client outcome. Every figure is a projection from the real benchmarks listed above; a specific property's results depend on its starting point, its market, its booking engine, and execution. We published the math in full so you can change any input and see how the answer moves — which is exactly what the calculator below lets you do with your own numbers.
// next_step