
Illustrative model — not a specific client. Every figure is a projection built from real 2026 benchmarks (Hawaii portal cost-per-lead ~$450, portal lead-to-close ~1%, organic/referral lead-to-close 14–30%, 78% of buyers hire the first agent to respond, 917-minute average agent response). It shows how the Reef Method would play out for a representative team — not a verified engagement outcome.
Modeled scenario // Hawaii real-estate team · portal-dependent lead mix
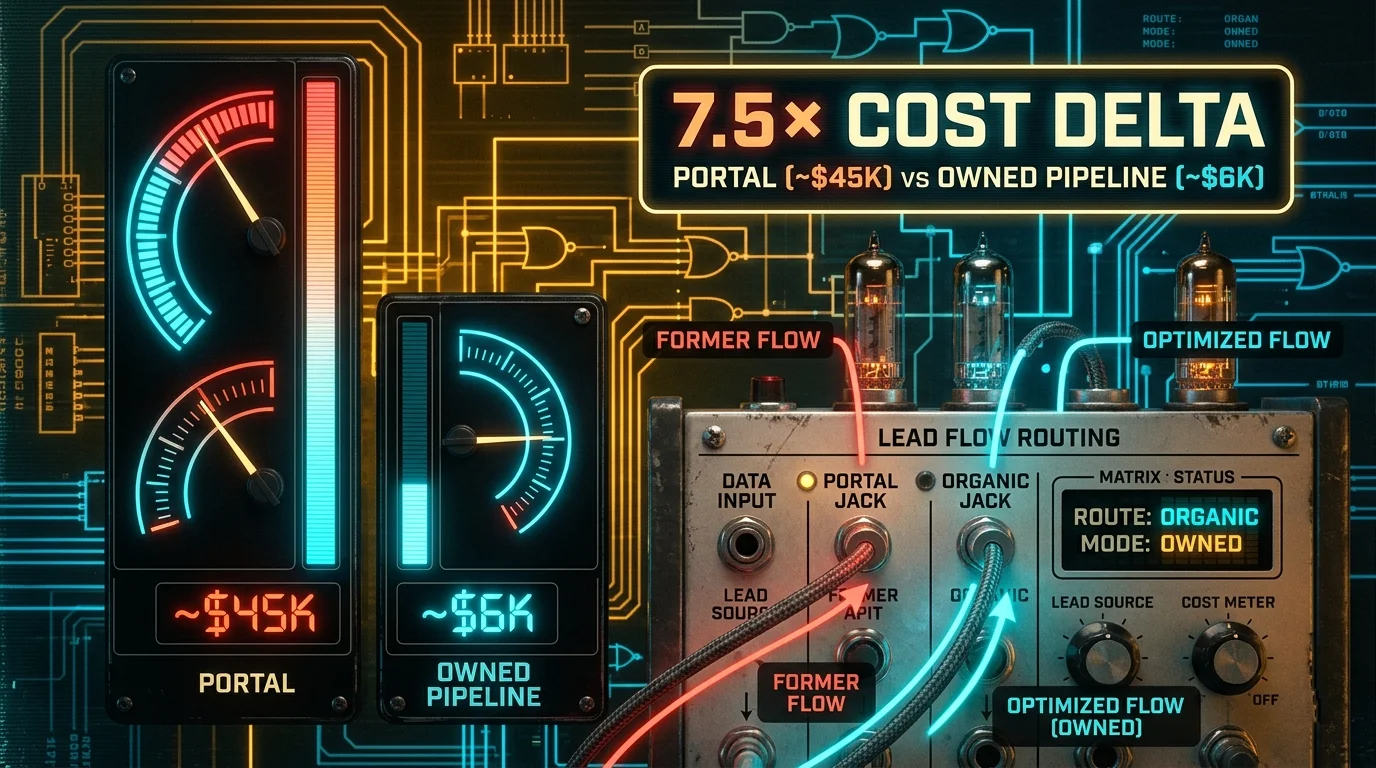
Cutting Cost-Per-Close From ~$45K to ~$6K.
An illustrative model — not a client. How a Hawaii real-estate team could escape the portal-lead trap, where a single closed deal can cost ~$45K in lead spend, by building an owned organic pipeline with the Reef Method.
$45K
Portal cost-per-close (modeled)
$6K
Owned-pipeline cost-per-close (modeled)
7.5×
Modeled cost-per-close improvement
The portal trap
Hawaii real-estate teams buy leads in one of the most expensive markets in the country. Portal cost-per-lead runs to ~$450 in hot Hawaii ZIP codes (NAR / Inman, 2025), and a purchased portal lead converts to a closing at roughly 1% — the documented range is 0.4–1.2%. Do that arithmetic and a single closed deal costs ~$45,000 in lead spend alone.
The same data shows two things working against the portal model: 78% of buyers hire the first agent who responds, yet the industry-average response time is 917 minutes (over 15 hours). Teams are paying premium prices for leads and then losing most of them to whoever answers first. Meanwhile organic and referral leads convert at 14–30% — roughly 15× better than portal leads — because they arrive with intent and trust already built.
The modeled team
A Hawaii team currently sourcing most of its pipeline from portal leads. We hold the inputs to documented benchmarks and change only where the pipeline comes from — not commission rates or market conditions.
- Portal cost-per-lead: ~$450 (Hawaii hot ZIP, NAR / Inman 2025).
- Portal lead-to-close: ~1% (documented range 0.4–1.2%).
- Organic / referral lead-to-close: ~15% (documented range 14–30%).
- Engagement cost: ~$3.5K/month (~$42K/year) for the Reef Method build.
The math, in full
Portal channel (status quo)
- Cost per lead: ~$450
- Leads per close at 1%: 100
- Lead cost per closed deal: 100 × $450 = ~$45,000
Owned organic pipeline (modeled, after content compounds)
- At ~15% lead-to-close, ~7 closings in year one from the compounding content base.
- Engagement cost spread across those closings: $42K ÷ 7 = ~$6,000 per close.
Modeled improvement ≈ 7.5× ($45K → ~$6K per close), and the gap widens every month after, because owned content keeps producing leads at near-zero marginal cost while portal pricing only rises. This is before the speed-to-lead lift from cutting response time below five minutes on the leads the team already pays for.
How the Reef Method gets there
01 · Substrate — answer first, every time
Speed-to-lead automation so inbound inquiries get a real response in under five minutes (the
single highest-leverage fix given that 78% hire the first responder), plus IDX/site performance
and RealEstateAgent + neighborhood schema so the team's own pages are fast and
machine-legible.
02 · Coral — own the questions buyers actually ask
Neighborhood and island guides, and education content on the Hawaii-specific decisions that portals answer badly: leasehold vs fee-simple, county short-term-rental ordinances, and the out-of-state and international buyer journey. This is the topical authority that produces owned leads — the primary layer for this team.
03 · Citations — compete to be the cited answer
AI-engine and local-pack visibility for "best real estate agent [town]" and neighborhood questions, so the team competes to be the recommended answer rather than a paid line item on a portal results page. (See our companion analysis, why AI struggles to cite Hawaii real estate, for the structural gaps this closes.)
04 · Ecosystem — compound the sphere
Reviews, brand mentions, and a referral/sphere loop so each closed deal feeds the next at no incremental lead cost — the opposite of the portal treadmill.
What this model is — and isn't
This is an illustrative model, not a client outcome. The conversion and cost benchmarks are documented; the year-one closing count and the cost-per-close trajectory are projections that depend on the team's market, starting point, and execution. Change any input in the calculator below to see how the answer moves for your own pipeline.
// next_step